A lower FOB golf ball quote can still lose once tariffs, freight density, MOQ, compliance fees, and inventory timing hit your warehouse.
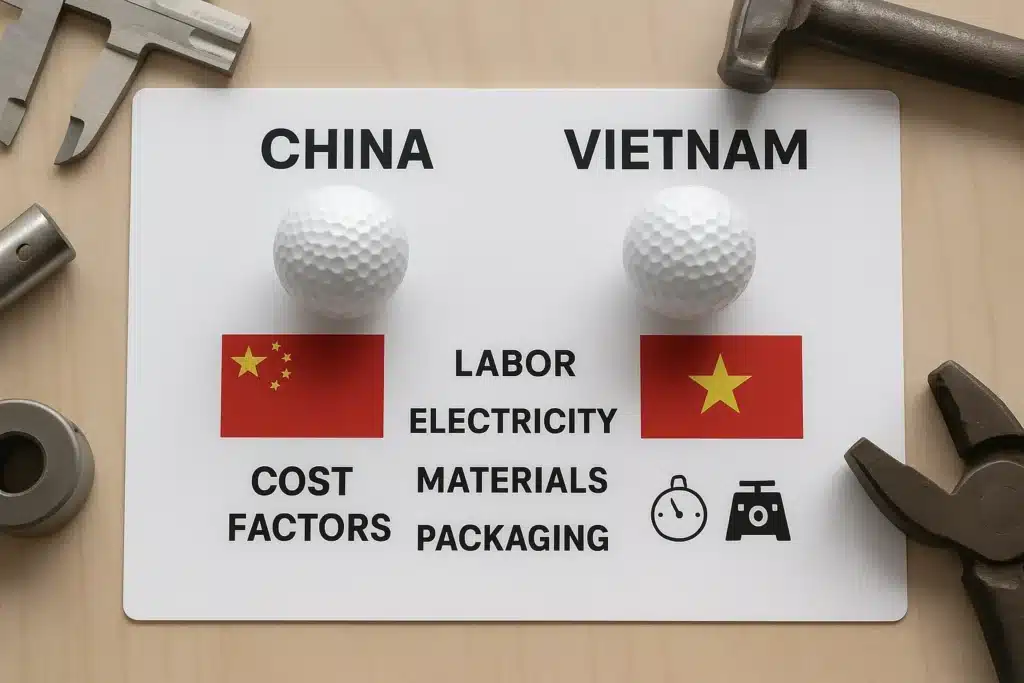
China vs Vietnam golf ball costs should be compared by landed cost, not FOB price alone. In 2026, China usually fits low-MOQ, fast-replenishment, packaging-heavy OEM programs, while Vietnam can win for tariff-sensitive U.S. or EU SKUs when Section 301 avoidance or EVFTA origin proof outweighs higher MOQ, longer lead time, freight density, USGA amortization, and inventory cost.
That is the real calculator you need.
If you are comparing China vs Vietnam golf ball costs, start with this formula: FOB or entered value + tariff/duty exposure + MPF/HMF or EU duty + freight per ball + packaging density + USGA amortization + inventory carrying cost. A quote that looks cheaper at the factory can become more expensive once HTSUS 9506.32.00.00 treatment, Section 301 exposure, EVFTA proof, MOQ, and lead time are included.
This guide keeps the finance lens. You will start with FOB baselines, then add U.S. tariff overlay, EU EVFTA opportunity, packaging density, compliance amortization, MOQ pressure, and inventory turnover before choosing China, Vietnam, or a dual-sourcing route.
What Is the Real Landed Cost Formula?
You may compare a China FOB quote and a Vietnam FOB quote as if factory price decides the winner, but the real cost appears after customs, freight, packaging, MOQ, and delays.
A China vs Vietnam golf ball landed cost calculator should include FOB price, entered-value basis, tariff exposure, MPF/HMF or EU duty, freight per ball, packaging density, MOQ, lead time, USGA amortization, and inventory carrying cost. The lowest FOB quote is not always the lowest accepted landed cost.
| Cost layer | China variable | Vietnam variable | Buyer action |
|---|---|---|---|
| FOB baseline | Often lower at scale | Can be close or higher | Normalize construction |
| U.S. tariff overlay | Check Section 301 | No China Section 301 layer | Verify HTS / Chapter 99 |
| EU duty | Third-country duty applies | EVFTA may reduce duty | Verify origin proof |
| Freight per ball | Dense port network | Similar rate, often longer transit | Model loaded balls |
| MOQ / cash cycle | Lower MOQ flexibility | More brand-tied | Compare inventory turnover |
| Compliance cost | Listing may be buyer-paid | Same channel decision | Amortize by order size |
The working formula is simple:
Accepted landed cost per ball = FOB or entered-value basis + tariff/duty exposure + MPF/HMF or EU duties + freight per ball + destination delivery + compliance amortization + defect/yield loss + inventory carrying cost.
Last year, an American buyer named Marcus asked us for a quote on 3-piece urethane golf balls. Our China FOB price was $1.25. A Vietnam factory quoted him $1.22. Eager to save $0.03 and avoid the ~7.5% U.S. Section 301 tariff on China goods, he politely declined our offer and sent his PO to Vietnam.
Last week, his inquiry popped up in my inbox again. After a quick call, he shared the brutal reality of his “cheaper” order.
First, to secure that $1.22 price in Vietnam, he was forced into a 50,000-piece MOQ, draining over $60,000 in working capital months before his launch. We had offered a 5,000-piece pilot run to test the market.
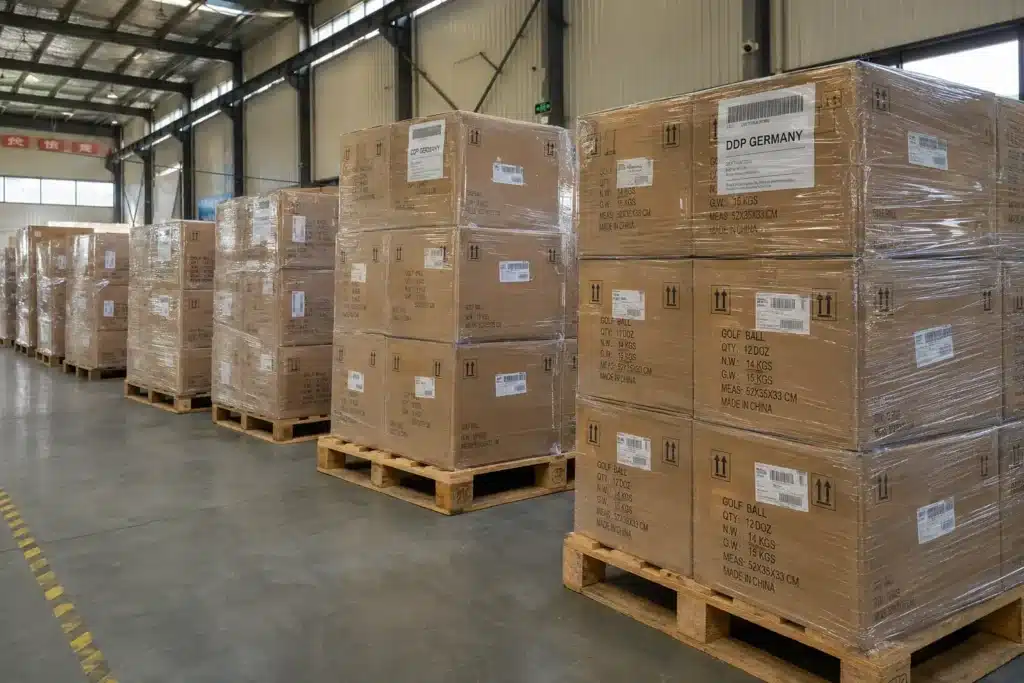
Second, his team chose oversized premium gift boxes. Because no one calculated the packaging density, his 40HC container only held 35,000 balls instead of the standard 80,000. His ocean freight instantly spiked from $0.04 to $0.09 per ball.
The final math? By the time the container reached his California warehouse, his “tariff-free” Vietnam balls cost him $1.40 landed.
If he had stayed with our China route—even with the 7.5% tariff added to the customs value—his landed cost would have been $1.36, and he would have kept $50,000 in the bank by running a smaller pilot first.
For U.S. buyers, golf balls are generally classified under HTSUS 9506.32.00.00 / 9506.32.0000. The base duty is Free, but Free base duty does not mean China-origin landed cost is free of tariff overlay. China-origin golf balls may still require Section 301 / Chapter 99 verification. Vietnam-origin balls do not carry the China Section 301 layer, but they still need customs user fees, brokerage, freight, and delivery modeling.
FOB quote, no tariff model is a failure signal. Duty should be calculated on customs entered value, not casually on the FOB quote. FOB examples are useful for buyer-friendly math, but your broker should confirm the entered-value basis before your sourcing decision becomes a PO.
Place this in your RFQ: “Please quote FOB, entered-value basis, HTS/HS classification, country of origin, Section 301 or EVFTA assumptions, MPF/HMF or EU duty treatment, carton dimensions, loaded balls per 40HC, estimated freight per ball, MOQ, lead time, and included/excluded logistics scope.”
✔ True — FOB is only the first number.
A Vietnam quote can win after tariff adjustment, or a China quote can still win after MOQ, packaging, and replenishment speed are counted.
✘ False — “Vietnam is cheaper if it avoids some tariffs.”
You should compare tariff savings against MOQ, lead time, freight density, origin proof, and inventory cost.

Ask your supplier to state country of origin, HTS/HS classification support, entered-value basis, COO documentation, and whether the quote assumes China Section 301 exposure, EVFTA preference, MPF/HMF, EU duty, VAT, brokerage, or inland delivery. Approve the supplier route only when the worksheet shows accepted landed cost under the same destination, packaging, MOQ, and delivery term.
How Do Tariffs Split China and Vietnam?
You may miss the biggest China–Vietnam cost difference if you only compare labor or electricity and ignore U.S. Section 301 and EU EVFTA treatment.
Tariffs can change the China vs Vietnam golf ball cost decision. For U.S. buyers, China-origin golf balls may need Section 301 verification even when the base HTSUS duty is Free. For EU buyers, Vietnam can be attractive when EVFTA origin proof reduces customs duty, but VAT and documentation still apply.
| Market | China-origin issue | Vietnam-origin issue | Buyer action |
|---|---|---|---|
| U.S. | Base duty Free, check Section 301 | No China Section 301 layer | Broker verifies Chapter 99 |
| U.S. fees | MPF/HMF still apply | MPF/HMF still apply | Model formal-entry fees |
| EU | Third-country duty exposure | EVFTA preference possible | Verify origin proof |
| EU VAT | VAT still applies | VAT still applies | Separate duty from VAT |
| Customs value | Use entered value | Use entered value | Do not use casual FOB math |
For buyers searching golf ball import tariffs from China to US, the key point is not the base duty alone. Under HTSUS 9506.32.00.00, golf balls may have a Free base duty rate, but China-origin entries can still require review for Section 301 tariffs on sporting goods and related Chapter 99 treatment. In a simple buyer model, a $1.00 entered value can become $1.075 before MPF, HMF, brokerage, and inland delivery if a 7.5% China tariff layer applies.
Vietnam-origin golf balls do not carry that China Section 301 layer for U.S. imports. That helps the landed-cost math, but it does not automatically make Vietnam cheaper. A longer production calendar, higher MOQ, slower cash conversion cycle, or poor packaging density can eat the tariff advantage.
For EU buyers, the EVFTA golf ball import duty angle is more important. China-origin golf balls under HS 9506.32.00 can face normal third-country duty treatment. Vietnam-origin goods can qualify for EVFTA preferential duty treatment when origin rules and proof are valid. EVFTA does not remove VAT. It reduces or removes customs duty only when the product qualifies and the documents support the claim.
EVFTA claim, no origin proof is a failure signal. A supplier saying “Vietnam duty advantage” is not enough. Ask for the origin declaration, production route, invoice consistency, and the exact country-of-origin documents your importer needs.

How Should U.S. and EU Buyers Model Duty?
U.S. buyers should model HTSUS 9506.32.00.00, entered value, MPF, HMF, and possible Section 301 / Chapter 99 exposure. EU buyers should model HS 9506.32.00, third-country duty, EVFTA preference, VAT, and origin proof.
A clean tariff model should separate duty from freight and VAT. For the U.S., compare China-origin and Vietnam-origin entries on the same entered-value basis, then add MPF, HMF, brokerage, port charges, and inland delivery. For the EU, compare China third-country duty against Vietnam EVFTA preference, then add VAT, importer obligations, clearance, and delivery.
For larger European retail programs, a few duty points can become real margin. On a 100,000-ball program, a small duty difference can be the budget for better packaging, local promotion, or a safety-stock buffer. But the duty saving must survive the rest of the landed-cost model: MOQ, production calendar, freight density, packaging volume, and working capital.
Buyer approval requires a landed-cost worksheet showing FOB, tariff/duty assumptions, freight per ball, packaging density, MOQ, lead time, and compensation basis if origin proof or tariff preference is rejected. Vietnam should only be selected for tariff reasons if documented duty savings exceed MOQ, freight, lead-time, and inventory costs.
What Are 2026 FOB Baselines?
You still need a factory-price baseline before adding tariffs and freight, but construction type changes the China–Vietnam comparison.
In golf ball OEM pricing 2026, China and Vietnam FOB prices can look close for 2-piece and 3-piece Surlyn, while multi-layer PU exposes bigger differences in yield, scale, overhead, and OEM access. Treat FOB as the baseline, then add tariff, freight, packaging density, MOQ, and lead-time cost.
| Construction | China FOB | Vietnam FOB | What changes after FOB? |
|---|---|---|---|
| 2-piece Surlyn | $10–15/dozen | $10–16/dozen | Tariff and packaging decide |
| 3-piece Surlyn | $15–22/dozen | $16–23/dozen | China often edges at volume |
| 3-piece PU | $20–30/dozen | $21–32/dozen | Yield and tariff drive outcome |
| 4-piece PU | $28–45/dozen | $30–46/dozen | China stronger for open OEM scale |
These are planning ranges, not fixed offers. Metallic inks can add about $0.10–$0.30/dozen. Multi-layer clear coats can add about $0.20–$0.50/dozen. Gift set packaging can add about $0.60–$1.50/dozen before freight density is counted. Artwork changes or reprints can create extra cosmetic rejects, and expedited slots can add overtime or line-changeover cost.
The original cost model is still useful because it shows why a simple labor comparison can mislead. Vietnam may look better on labor and electricity cells. China can still win after yield, scale, supplier radius, open OEM access, and packaging integration are counted.
| Construction | China subtotal / ball | Vietnam subtotal / ball | U.S. China tariff sensitivity | What to verify next |
|---|---|---|---|---|
| 2-piece Surlyn | $0.45 | $0.44 | Higher if Section 301 applies | Tariff, packaging, MOQ |
| 3-piece Surlyn | $0.63 | $0.62 | Higher if Section 301 applies | Volume and supplier radius |
| 3-piece PU | $1.25 | $1.22 | Higher if Section 301 applies | Yield and capacity access |
| 4-piece PU | $1.44 | $1.41 | Higher if Section 301 applies | Open OEM scale and schedule |
A supplier-filled cost model should include materials, electricity, labor, packaging, yield assumptions, carton data, tariff treatment, and freight per ball. If the factory refuses to break out even basic drivers, you may still buy from them, but you should not pretend the quote is financially transparent.

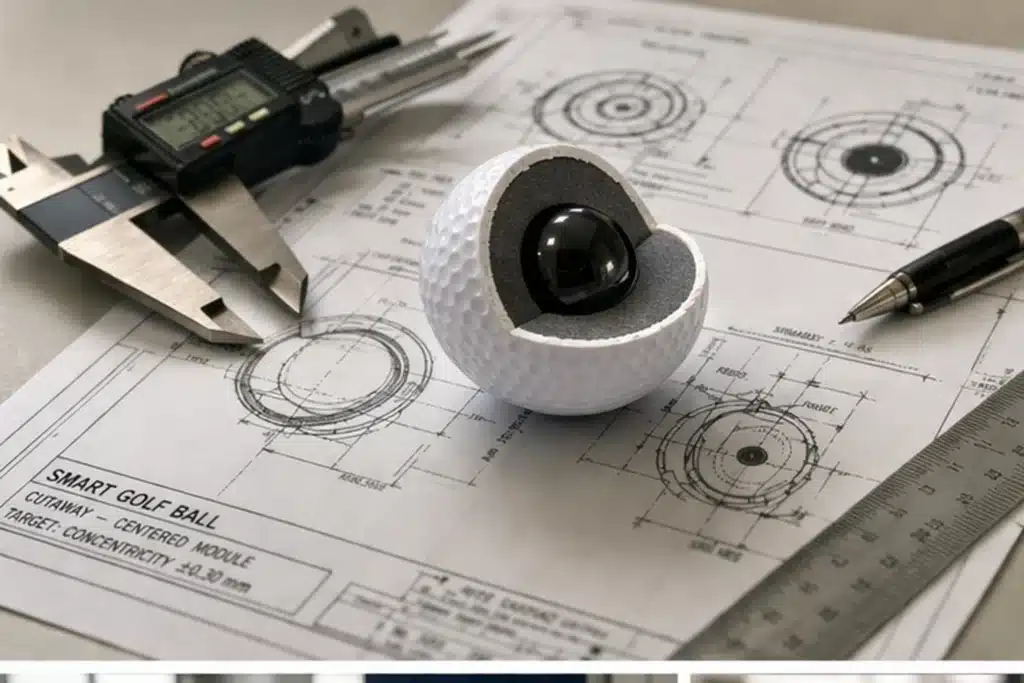
Why Does Multi-Layer PU Widen the Gap?
Multi-layer PU widens the cost gap because every extra layer adds yield exposure, setup complexity, production scheduling pressure, and overhead absorption. Lower electricity or labor does not automatically create a lower accepted landed cost.
Vietnam can be competitive in spreadsheet line items, especially where labor and kWh assumptions look favorable. The problem is that PU programs are more sensitive to scrap, rework, finishing defects, and schedule availability. A small yield swing can move the effective cost faster than a small energy saving.
China’s advantage is cluster depth. Molds, inks, cartons, printing support, packaging vendors, and export logistics are closer together in major Chinese golf ball regions. That shorter supplier radius can reduce waiting, rework, and late-stage mismatch. Vietnam can be a strong tariff hedge or brand-linked node, but open OEM lanes may be narrower and schedules can be more constrained.
Request construction-specific FOB quotes and a supplier-filled line-item cost model. Compare materials, labor, electricity, packaging, yield assumptions, and tariff-adjusted landed cost. Do not choose a supplier until the FOB baseline and post-FOB cost layers are modeled together.
✔ True — Factory cost and landed cost are different decisions.
FOB helps you compare manufacturing baselines. Landed cost shows whether that quote survives tariffs, freight, packaging, MOQ, and replenishment timing.
✘ False — “Lower electricity means lower FOB.”
You should compare total burdened cost after yield, scale, supplier radius, and capacity are included.
How Does Packaging Density Kill Margin?
You may approve premium packaging for brand appeal and discover that it reduces container loading enough to erase FOB or tariff savings.
Packaging density can erase tariff or FOB savings. At a $3,200 40HC ocean rate, a compact 100,000-ball load adds $0.032 per ball, while an oversized gift-box load of 35,000 balls adds about $0.091 per ball before customs, duties, destination charges, and trucking.
| Packaging style | Loaded balls / 40HC | Freight at $3,200 | Freight / ball | Buyer action |
|---|---|---|---|---|
| Bulk / mesh / compact white box | 100,000 | $3,200 | $0.032 | Use for MVP and replenishment |
| Retail sleeve + efficient carton | 80,000 | $3,200 | $0.040 | Use if shelf price supports it |
| Premium gift box | 50,000 | $3,200 | $0.064 | Check margin before approval |
| Oversized EVA gift set | 35,000 | $3,200 | $0.091 | Reserve for high-ticket gifting |
Packaging is often approved by marketing but paid for by operations. A larger sleeve, premium gift box, EVA insert, or oversized holiday set can reduce the number of balls per carton and the number of cartons per 40HC. The freight bill may stay the same while the freight per ball rises sharply.
China and Vietnam ocean rates to the U.S. West Coast can be similar in a planning model. The bigger differences may be container loading, sailing density, transit time, factory calendar, and how quickly packaging vendors can fix problems. Premium box, no container-load estimate is a failure signal. It means no one has connected the artwork decision to landed cost.
For MVP launches, DTC replenishment, and value retail, compact packaging usually protects margin. Use bulk, mesh bag, or compact white box until sell-through is proven. Upgrade to premium packaging when MSRP, wholesale margin, and gift-channel positioning can absorb both the packaging cost and freight-density penalty.
Ask both China and Vietnam suppliers for carton dimensions, balls per carton, cartons per 40HC, gross weight, CBM, and estimated freight per ball. Your forwarder should verify whether the load plan is realistic for the booking lane. Premium packaging should only be approved when margin covers lower container density.

When Is USGA Listing Worth Paying For?
You may force a current USGA/R&A listing into a small order and accidentally add a large compliance cost per ball.
USGA listing can become a compliance tax on small golf ball OEM orders. If one ball type costs $1,200 for annual submission and your test order is 3,000 balls, the listing cost alone adds $0.40 per ball before manufacturing, freight, customs, or packaging.
| Compliance scenario | Cost | Order volume | Cost / ball | Buyer action |
|---|---|---|---|---|
| One model annual submission | $1,200 | 3,000 balls | $0.40 | Use only if channel needs it |
| Four models annual submission | $4,800 | 3,000 balls | $1.60 | Avoid for test SKUs |
| One model annual submission | $1,200 | 20,000 balls | $0.06 | Possible for premium SKU |
| One model annual submission | $1,200 | 100,000 balls | $0.012 | Easy to amortize |
USGA submission and annual resubmission costs are not magic supplier overhead. Somebody pays. If the factory maintains four ball types, the annual listing burden can reach $4,800 before sample, courier, communication, and admin costs. With supporting costs, a four-model program can approach about $5,500–$6,000 per year.
For a 3,000-ball trial, a single $1,200 model cost becomes $0.40 per ball. If a buyer expects four current listed models but only places one small test order, the math becomes brutal. That is the compliance tax trap.
Current listing matters for tournament, elite, club championship, and conformance-sensitive channels. It may not be commercially necessary for practice balls, range balls, corporate gifting, entry-level DTC, or promotional packs. In those cases, your budget may work harder when spent on lot records, weight and diameter checks, durability review, packaging inspection, and retained samples.
Ask whether current USGA/R&A listing is included, buyer-paid, supplier-paid, or not required. Check whether your target channel requires current conforming-list status. Do not force listing into practice, gifting, range, or entry-level DTC programs unless the customer requires it.
✔ True — Listing is a channel cost.
If your sales channel needs tournament conformance, listing can be justified. If the channel does not monetize it, the same money may protect margin better elsewhere.
✘ False — “USGA listing is always worth requiring.”
Pay for listing only when your channel requires or monetizes it.
How Does China MOQ Free Cash Flow?
You may chase Vietnam tariff advantages and lock working capital into high MOQ, longer lead time, and slow-moving inventory before the SKU is proven.
China’s low MOQ can protect cash flow even when Vietnam offers tariff advantages. A 1,000–3,000-piece China pilot lets you test demand, packaging, and sell-through before locking capital into higher MOQ or slower Vietnam schedules; once volume is proven, Vietnam can become a tariff hedge for mature SKUs.
| Decision point | China | Vietnam | Buyer action |
|---|---|---|---|
| Best use | MVP, low MOQ, fast replenishment | Tariff hedge, mature EU SKU | Match route to SKU stage |
| MOQ pressure | Lower / flexible | Higher / brand-tied | Do not overbuy test SKUs |
| Production calendar | Often faster | Often longer | Model cash cycle |
| Tariff role | U.S. Section 301 risk | EU EVFTA opportunity | Use broker proof |
| Hidden risk | Tariff + packaging density | Lead time + origin proof | Dual-source carefully |
This is where golf ball OEM minimum order quantity becomes a finance decision, not just a factory rule. A lower MOQ reduces cash trapped in inventory, lowers the cost of a wrong SKU, and gives your team more room to test packaging, pricing, and customer response.
Original lead-time planning shows why cash conversion matters. China sampling can often be planned around 2–3 weeks and mass production around 25–40 days. Vietnam may be closer to 3–5 weeks for sampling and 35–55 days for mass production, with more brand-system or schedule constraints. For some China 2-piece Surlyn programs after sample approval, production can be much faster; 3-piece PU programs usually need more time.
China’s regional cluster logic also matters. Zhejiang and Ningbo-style flexible supply can support low-thousand-piece custom programs, and Golfara can support custom programs from about 1,000 pcs where the construction, artwork, and packaging plan fit. That flexibility is not only a production feature. It is a cash-flow tool.
Tariff savings only matter when they survive MOQ, freight, lead time, and packaging density. A new brand should not force 50,000 balls into a high-MOQ route before sell-through is proven. Use China for MVP, packaging validation, logo approval, and replenishment rhythm. Move mature, locked-spec, high-value volume to Vietnam only when origin proof and duty savings exceed the cash-cycle cost.
For more detail on MOQ negotiation, see how to negotiate MOQ with Chinese golf ball manufacturers. If your team is still building a supplier map, compare options in the Top 10 Golf Ball Manufacturers in China for OEM guide.
Ask for quote paths by MOQ: China pilot, China replenishment, and Vietnam mature-volume tariff hedge. Calculate inventory turnover in golf ball sourcing and cash conversion cycle under each route. Start in Vietnam only when order volume, origin proof, tariff savings, and sell-through justify the working-capital lock.

FAQ
Are golf balls made in China subject to U.S. tariffs?
The base HTSUS duty for golf balls is generally Free, but China-origin golf balls may still require Section 301 / Chapter 99 verification. Buyers should model Section 301 exposure, MPF, HMF, brokerage, and inland delivery before assuming the quote is duty-free.
- Verify HTSUS 9506.32.00.00 / 9506.32.0000.
- Use customs entered value.
- Ask your broker to confirm Chapter 99 treatment.
A China FOB quote is not enough for U.S. landed-cost planning. Even when the base duty is Free, the entry may still need China tariff review. Ask the supplier for COO evidence and ask your broker to model the tariff treatment before you approve the origin route.
Is Vietnam cheaper than China for golf balls?
It depends on the landed-cost model. China often wins on FOB, MOQ, packaging speed, and replenishment; Vietnam can win when tariff savings or EVFTA origin value outweigh higher MOQ, longer lead time, and supply-chain friction.
- Compare FOB first.
- Add tariff, freight, and packaging density.
- Add MOQ and cash-cycle cost.
Vietnam is not automatically cheaper, and China is not automatically the better landed-cost route. The winner changes by market, SKU stage, volume, packaging, origin proof, and delivery deadline. Mature EU SKUs may favor Vietnam. MVP, DTC, promo, and fast replenishment programs often still favor China.
What is the EU import duty on golf balls?
EU duty depends on origin and preference eligibility. China-origin golf balls can face normal third-country duty, while Vietnam-origin goods may qualify for EVFTA preferential treatment if origin rules and proof are valid. VAT still applies.
- Check HS 9506.32.00.
- Verify EVFTA origin proof.
- Separate customs duty from VAT.
EVFTA can improve duty treatment, but it is not automatic. Buyers need valid origin qualification and supporting documents. VAT, importer responsibilities, customs clearance, and local delivery still need to be modeled separately from duty.
Why are brands dual-sourcing golf balls from China and Vietnam?
Dual sourcing lets buyers use China for low MOQ, fast sampling, custom packaging, and replenishment, while using Vietnam for mature high-volume SKUs where tariff or origin advantages justify the route.
- China for MVP and speed.
- Vietnam for mature tariff-sensitive volume.
- Keep specs, packaging, and origin proof aligned.
The strongest dual-sourcing plan is SKU-based. Use China to test demand, packaging, artwork, and reorder cadence. Use Vietnam when the SKU is stable, volume is high, and tariff or origin benefit is worth the longer schedule and documentation burden.
How do I calculate golf ball freight per unit?
Use this formula: freight per ball = container freight ÷ loaded balls. Packaging density controls the result, so a gift box can raise freight per ball even when the container rate is unchanged.
- Ask for balls per carton.
- Ask for cartons per 40HC.
- Verify freight per ball before approving packaging.
A compact 40HC load can keep freight per ball low. Oversized packaging can double or triple the per-ball freight allocation. That is why procurement should request carton dimensions before marketing approves the final gift box.
When is USGA listing worth the cost?
USGA/R&A listing is worth paying for when the sales channel needs tournament conformance or formal model proof. For practice, gifting, range, or low-volume DTC, the cost may be better spent on QC reports and lot evidence.
- Amortize the fee by volume.
- Define who pays submission or renewal.
- Do not require listing by habit.
Listing is not a bad cost. It is a channel-specific cost. If your customer needs conformance-list status, write it into the quote and PO. If your channel does not require it, do the amortization before forcing it into a small order.
What MOQ should a new golf ball brand choose?
A new brand should usually start with the lowest MOQ that can prove demand without tying up cash. China’s low-MOQ OEM path often fits MVP testing better than committing to a high-volume tariff hedge too early.
- Use 1,000–3,000-piece pilots where available.
- Keep packaging simple.
- Move volume only after sell-through is proven.
Your first order should test the SKU, not trap your cash. A smaller China pilot can validate artwork, packaging, reviews, returns, and reorder timing. Once the SKU proves sell-through, you can consider larger dual-sourcing or Vietnam tariff-hedge routes.
Can Vietnam replace China for all golf ball sourcing?
Not usually. Vietnam can be useful for tariff hedge, EVFTA strategy, and mature SKU routing, but China remains stronger for open OEM access, fast logo work, packaging integration, lower MOQ, and broader replenishment flexibility.
- Use Vietnam where tariff math works.
- Use China where speed and MOQ matter.
- Avoid one-country sourcing assumptions.
The best route depends on SKU economics. A high-volume EU flagship may justify Vietnam if EVFTA origin proof is valid. A low-MOQ DTC launch or corporate gift program may be safer in China because speed, packaging, and cash conversion matter more.
Conclusion
China vs Vietnam golf ball costs should not be decided by FOB alone. China often gives buyers stronger speed, MOQ flexibility, packaging integration, and replenishment control. Vietnam can be a useful tariff hedge or origin route when the SKU is mature, volume is high, and origin proof supports the duty preference.
The better decision is tariff-adjusted accepted landed cost. Start with FOB, then add HTS/HS treatment, Section 301 or EVFTA assumptions, MPF/HMF or EU duty, VAT where applicable, freight per ball, packaging density, USGA amortization, MOQ, lead time, and cash conversion cycle.
For new programs, China is often the safer MVP route. For mature, high-value, locked-spec programs, Vietnam may become the smarter tariff hedge. The strongest sourcing plan is not China-only or Vietnam-only. It is the route that keeps your margin alive after customs, freight, packaging, and inventory timing are counted.
You might also like — Top 4 Golf Ball Manufacturers in Vietnam for OEM (2026 Directory)