Step by step, golf balls are made in 10–12 stages: materials prep; core mixing; core vulcanization; core finishing; (optional) mantles; cover forming (ionomer injection or cast urethane); urethane post-cure; seam finishing; coating; pad/UV printing; final inspection; packaging. Key CTQs: compression, concentricity, dimple fidelity, paint uniformity, symmetry.
Golf balls look simple—just a white sphere with dimples. In truth, the product is a layered system with tight tolerances at every stage. Each yard of distance and each degree of spin emerges from a chain of small, well-controlled decisions. You want repeatability, not luck.
That is why factories lock their critical-to-quality (CTQ) limits and build lines around them. When CTQs drift, golfers feel it. Distance turns erratic. Flight becomes biased. Coatings age too fast. Your job as a buyer is to keep the process honest with clear specs, test methods, and reaction plans.
🎥 Inside Golfara — Factory Overview
Before we dive into the sequence, take a quick tour inside Golfara. Use this to map each step you’ll read about to real production cells, gauges, and finishing areas.
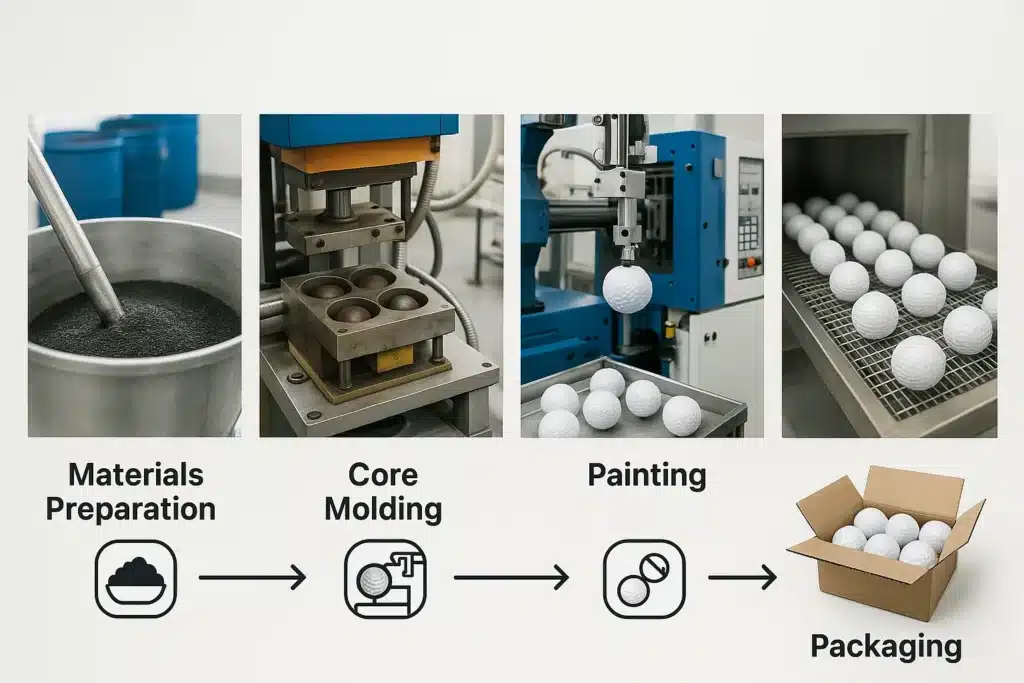
Inside Golfara: core molding, cover forming, seam finishing, coating booths, pad/UV printing, and in-line QA.
You will see internal mixers that prepare core compounds, presses that cure the cores, mantle equipment for multi-layer builds, cover stations for injection and cast urethane, and finishing cells that handle seam control, coating, and printing. You will also see gauges for weight, diameter, compression, symmetry, and Initial Velocity (IV). These gauges form the control plan that lets you scale quality.
Process at a Glance
Summary: The flow is mix → mold → build layers → form cover → finish → coat/print → QC. Complexity spikes at the core, cover, and coating stages. These CTQs determine speed, straightness, durability, and long-term conformity.
10–12 Steps (anchored for quick scanning)
1) Raw materials receiving & pre-treatment
2) Rubber mixing (internal mixer/Banbury)
3) Core vulcanization (molding & cure)
4) Core finishing / surface activation
5) Mantle molding (multi-layer only)
6) Cover forming — ionomer injection or cast urethane
7) (PU only) post-cure & conditioning
8) Seam/flash removal & roundness check
9) Coating (primer/top/clear)
10) Printing (pad/UV)
11) Final inspection & grading
12) Aging & packaging
Master Table — Step × Function × CTQ × If Bad
| Step | What it does | CTQs (must hold) | If it goes wrong (on-course feel) |
|---|---|---|---|
| 1. Materials prep | Purity & lot stability | Moisture; resin/monomer purity; lot match | Cure drift; adhesion/color issues |
| 2. Rubber mixing | Sets compression/COR potential | Dispersion; temp/torque curve; scorch safety | Distance loss; brittle/soft feel |
| 3. Core vulcanization | Elastic “heart” | Cure T/t/P; Atti compression; Ø/weight; voids | Distance spread; cracks |
| 4. Core finishing | Bondable surface, roundness | Surface energy; grind/sand/plasma; roundness | Delamination; out-of-round |
| 5. Mantle molding | Tunes speed vs. spin | Layer thickness & concentricity; Shore D; adhesion | Wild spin; cut failures |
| 6. Cover forming | Durability, feel, dimples | Injection: melt/pack/hold; PU: ratio, vacuum, cure; seam | Flight bias; lift/drag inconsistency |
| 7. Post-cure (PU) | Final toughness/feel | Temp/RH profile; hardness balance | Yellowing; adhesion issues |
| 8. Seam finishing | Aerodynamic symmetry | Seam height; roundness; dimple integrity | “Mystery fade/draw” |
| 9. Coating | UV/soil, feel, micro-roughness | μm-level thickness; adhesion; cure window | Extra drag; peel |
| 10. Printing | Branding/alignment | Ink–clear compatibility; registration | Smearing; poor durability |
| 11. Final QC | Compliance & uniformity | ≤45.93 g; ≥42.67 mm; symmetry; IV; compression; AQL | Non-conforming; reputation hit |
| 12. Pack/Aging | Shipping stability | ISTA drops; lot traceability | Shelf defects; claims |

Two Main Routes (Ionomer vs. Cast Urethane)
Summary: Ionomer injection favors durability, cost control, and throughput. Cast urethane favors tour feel and greenside spin. Early steps are shared; divergence happens at the cover and, for urethane, post-cure/conditioning that stabilizes hardness, toughness, and ink/clearcoat adhesion.
Route A — 2-/3-piece Ionomer (Injection Cover). You mix and cure the core, finish and activate the surface, optionally add a mantle, then injection mold the cover in a dimpled cavity. The melt flows, packs, and cools under pressure. The part ejects with integrated dimples. After deflash, you coat, print, inspect, and pack.
Route B — 3/4/5-piece Cast Urethane (Tour-leaning). You mix and cure the core, form multi-mantle layers, then meter and degas liquid urethane. You cast two halves in precision shells, encapsulate the inner ball, cure, then post-cure and condition humidity. After seam management, you coat, print, inspect, and pack. This route is sensitive, but it pays back with feel and spin.
Route Comparison — Snapshot
| Cover route | Process snapshot | Main strengths | Watch-outs (CTQ) | Typical use case |
|---|---|---|---|---|
| Ionomer Injection | Melt → inject → pack/hold → eject (dimples in mold) | Cost/performance, durability, throughput | Tool hygiene; short-shot/flow lines; concentricity | Range and value Game |
| Cast Urethane | Metered mix → vacuum/degas → cast halves → cure → post-cure | Tour feel, greenside spin, cut resistance | Ratio accuracy; bubbles; seam; conditioning | Tour-leaning and premium Game |
Step-by-Step with Functions & CTQs
Summary: Each stage contributes a specific lever—speed, spin, feel, durability, or aerodynamics—anchored by measurable CTQs and acceptance limits. Put those limits in your PO and require reporting (with CPK and reaction plans) to keep them live.
Core mixing → vulcanization. The core sets Atti compression and COR—the ceiling for distance and feel. CTQs include dispersion quality (you need uniform ZnO/ZnA/peroxide/filler), cure temperature/time/pressure, diameter/weight tolerance, and void control. Off-window batches create distance spread, harsh or mushy feel, and, in extremes, cracking after impact. A strong factory watches the mixing torque curve, cure profile, and batch spread like a hawk.
Mantle(s). Mantles fine-tune launch and wedge spin while improving cut resistance. CTQs include layer thickness, concentricity, Shore D hardness, and strong bonds to core and cover. Hardness gradients must be stable; otherwise short-game spin becomes unpredictable. Mantles also smooth the transition between core and cover so impact forces do not cause localized damage.
Cover forming. Injection cover lines control melt temperature, pack/hold pressure, time, and residence. Tool hygiene preserves dimple edges and depth. Cast urethane lines lock mix ratio, vacuum/degassing, flow, cure, and seam finishing. Concentricity is non-negotiable. Off-center mass tilts the spin axis and creates a “steers itself” flight that players will notice even without knowing why.
Finish. Seam height and roundness govern aerodynamic symmetry. The job is to flatten the seam without deforming dimples or ruining roundness. At this stage, a careless polish can introduce bias. A careful polish keeps the ball neutral.
Coating/Printing. Coatings deliver appearance, UV resistance, and micro-roughness. μm-level uniformity preserves distance and dispersion. Too much paint adds drag; uneven paint adds asymmetry. Pad/UV printing adds branding and alignment with negligible mass, but ink-to-clear compatibility and cure windows matter. You want clean edges and high rub resistance.
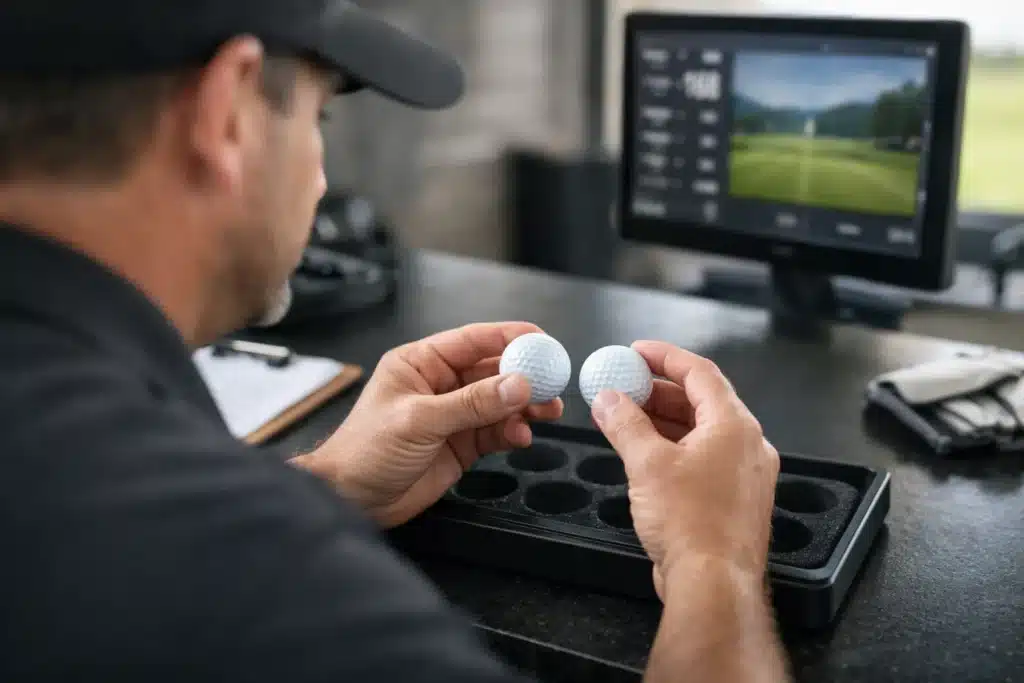
Final QC. Conformity demands weight ≤45.93 g and diameter ≥42.67 mm, plus symmetry and initial velocity (IV). Compression and AQL cosmetics complete the check. Grading protects your brand. A disciplined factory will also retain lot data, from cure curves to paint microns, so you can trace any issue later.

CTQ Gate Map — What to Measure and With What
| CTQ gate | Why it matters | Primary measurements | Typical tools | Common reactions |
|---|---|---|---|---|
| Core compression/COR | Distance & feel baseline | Atti; COR/IV; cure curve | Compression tester; IV rig; MDR/DSC | Adjust cure window; re-balance mix |
| Concentricity | Directional neutrality | CG deviation; seam height; radial thickness | X-ray; rotation gauge; roundness gauge | Re-center molds; scrap/contain |
| Dimple fidelity | Lift/drag curves | Depth; edge sharpness; count schema | Optical inspection; templating | Clean/repair tools; repaint if clogged |
| Coating uniformity | Drag & appearance | Thickness (μm); adhesion; abrasion | Micron gauge; cross-hatch; rub | Rework/strip-recoat; tune viscosity |
| Symmetry & legality | Conformity; consistency | Symmetry test; weight; diameter | Symmetry/roll test; digital gauges | Stop-ship; re-grade; corrective action |
To make this practical, link each CTQ to a reaction plan. If paint thickness trends high, slow the line, adjust viscosity, or reduce passes. If concentricity drifts, re-center tooling and contain the lot. If IV trends down, inspect core cure and mantle hardness. Every drift deserves a rule, not a debate.
What Goes Wrong → What Golfers Feel
Summary: When a factory loses a CTQ, golfers feel it: distance yo-yo, random sidespin, wind instability, early scuffs/yellowing, or even non-conforming sizes. Translate complaints into root causes so you fix the right step fast.
| Failure mode | Likely root cause | Golfer perception | First diagnostic |
|---|---|---|---|
| Distance varies ±5–10 yd | Core cure drift; coating thickness spread | “Some shots feel hot, some dead.” | Compression & COR spread; paint μm variance |
| Unexplained fade/draw | Eccentric layers; seam/dimple damage; paint asymmetry | “The ball steers itself.” | X-ray concentricity; seam height profile |
| Into-wind drop / down-wind over-float | Poor dimple replication; paint in dimples | “Wind makes it go weird.” | Optical dimple check; repaint audit |
| Easy scuff/cuts | PU under-cure; brittle ionomer blend | “Scuffed after one wedge.” | Shore hardness; cure confirmation |
| Early yellowing/peel | Weak clear; contaminated surface | “Looks old too soon.” | Adhesion test; solvent residue check |
| Non-conforming | >45.93 g; <42.67 mm; symmetry/IV fail | “Not legal for competition.” | 100% weight/diameter gate; symmetry test |
Coating & Printing (μm-Level Thickness and Registration)
Summary: Coatings (primer/top/clear) govern appearance, UV resistance, and feel; uniform μm-level thickness preserves distance. Pad/UV printing adds branding and alignment with negligible performance impact when ink–clear compatibility and cure are controlled. Specify total and per-zone coating thickness (μm) with SPC trend limits in your acceptance plan.
A modern coating stack does three things. It protects the surface, tunes feel through micro-roughness, and carries the gloss you want for shelf appeal. Your acceptance plan should call out total thickness and its uniformity, not just “looks good.” The correct number is program-specific. The correct test is simple: a micron gauge, a cross-hatch adhesion test, and rub resistance. Printing should not lift the clear. Clear should not blur the print. Cure windows matter for both.
Coating CTQs. Thickness uniformity; adhesion; cure window; abrasion resistance.
Printing CTQs. Registration; ink–clear compatibility; cure schedule; rub/chemical resistance.
🎬 Golfara Pad/UV Printing — registration, compatibility, abrasion checks
From Cells to a Line: Assembly → Final QC
Summary: Core molding, cover forming, seam finishing, coating, and printing run as synchronized cells with in-line gauges. They feed final inspection & grading for symmetry, IV, compression, weight, diameter, and AQL, protecting conformity before pack-out.
🎬 Golfara Assembly Line — synchronized cells and in-line gauges
Brand Case — Golfara’s Differentiation (Aligned to CTQs)
Summary: Golfara focuses on ultra-thin cover capability, concentricity control, and dual-layer nano clear to stabilize distance and extend life—validated by compression/COR, symmetry/IV, μm-level coating, and abrasion tests.
A golf ball is small, but the control plan is big. Golfara converts CTQs into routine line actions with measurable gates. We link mixing torque curves to cure profiles, then to concentricity and paint microns, and finally to IV and symmetry. That is how we keep distance, direction, and durability steady across seasons.
What we do differently and how it maps to CTQs.
-
Core first (Compression/IV). Rubber-mix dispersion and cure profiles hold Atti compression and COR within tight bands, cutting lot-to-lot spread and temperature sensitivity.
-
Ultra-thin cover (≈0.8 mm on specific designs). Tooling and process-window optimization deliver thinner, more uniform covers (when the design allows), lowering tolerance stack-up and improving speed retention and dispersion without sacrificing durability.
-
Dual-layer nano clear. Compared with single-layer programs under equal test conditions, our abrasion resistance rises 50%+, with +5–10% uplift in rebound indicators; each claim is tied to a program-specific protocol and can be third-party verified.
-
Layer catalog (up to 7 layers). Core + multiple mantles + cover (ionomer injection or cast urethane) allow a direct fit for range, game, or tour-leaning targets.
-
Concentricity & dimples. X-ray/rotation gauges and disciplined tool cleaning reduce aerodynamic bias so the spin axis stays neutral.
-
Coating microns under control. We track μm thickness, adhesion, and abrasion to avoid distance-robbing thickness or early peel while keeping gloss and branding crisp.

Regional Landscape — Where to Make What
Summary: USA/Japan/Thailand concentrate tour-grade repeatability; Taiwan excels at cast + injection OEM depth; China/Vietnam win on scale and agility, with urethane capacity growing.
| Region | Strength snapshot | Best use cases |
|---|---|---|
| USA (Titleist/Callaway/Bridgestone) | Multi-layer concentricity; cast PU; automation, SPC, traceability | Flagship tour-grade |
| Japan (Srixon/Bridgestone) | Aerodynamics & consistency; gradient tuning | Stable Game/Tour |
| Thailand (Titleist BP4) | BP3-standard replication; scale + consistency | APAC flagship supply |
| Taiwan (Foremost/Launch) | Cast + Injection OEM depth | High-spec OEM & DTC |
| China | Ionomer injection at scale; complete packaging ecosystem | Range/Game, kits, quick-turn |
| Vietnam (SM Parker) | Multi-layer urethane outsourcing | Cost–quality balance |
When you evaluate plants, ask for a process walk with live data. You want to see core cure profiles, X-ray concentricity plots, paint micron trends, and IV results. You also want to see the reaction plans that fire when trends drift. Good lines are consistent on normal days and resilient on bad days.
QA Plan & Acceptance Tests
Summary: Lock use (Range/Game/Tour), structure (layers/cover/hardness), and CTQs & methods. Enforce 100% gauges for weight/diameter and routine symmetry/IV/compression audits with CPK reporting and clear stop-ship triggers.
✔ True — Test reports only cover a specific sample
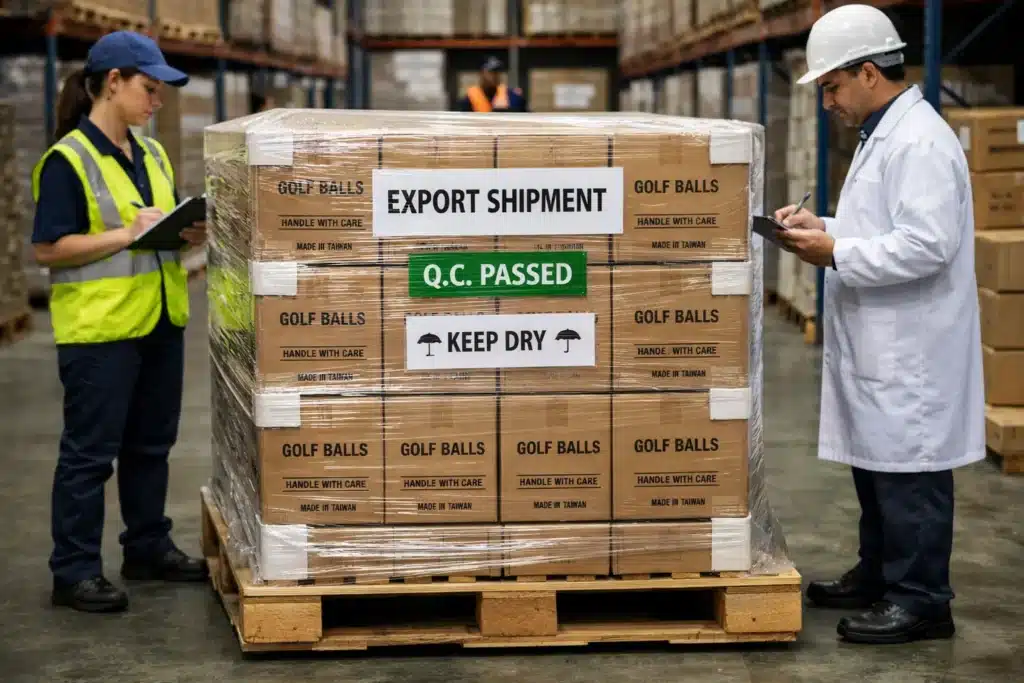
Lab reports validate one batch, not entire production. Each shipment needs batch-level quality control and possibly third-party verification to ensure ongoing compliance.
✘ False — “They sent a report, so the whole shipment is fine”
Relying blindly on test certificates can be misleading. Real quality requires ongoing vigilance, not just one report.
| Item | Method | Typical target/check | Notes |
|---|---|---|---|
| Weight / Diameter | Digital gauges | ≤45.93 g; ≥42.67 mm | 100% gate |
| Compression (Atti) | Compression tester | Spec window ± tolerance | Tie to COR/IV |
| Initial Velocity (IV) / COR | Instrumented test | Program-specific limit | Include temperature |
| Concentricity / Symmetry | X-ray or rotation gauge | CG-neutral; seam limit | Define acceptance bands |
| Coating | Thickness (μm), adhesion, abrasion | Uniformity; pass cross-hatch/rub | μm SPC trending |
| Dimple fidelity | Optical/template checks | Depth/edge within spec | Tool cleaning logs |
| AQL cosmetics | Visual + fixtures | Program-defined | Rework/re-grade path |
✔ True — Mass production must match the sample precisely
Once a sample is approved, the same materials, processes, and QC standards must be frozen and applied to bulk production. Any deviation should be pre-approved.
✘ False — “Once the sample’s approved, the mass goods will match automatically”
Assuming that approved samples will ensure quality without process control often leads to disappointment.
Here is a practical rhythm for a new program. Lock the spec and test plan in the quote. Approve a pre-production run with full data. Ramp with enhanced sampling and temporary 100% gates. Once CPK proves stable, relax to steady-state sampling. Keep IV and symmetry on a fixed cadence. Hold a monthly review on drift, not only on defects.
Lead Time, MOQ & Compliance
Summary: Lead time includes materials, tooling and mold upkeep, line slots, curing/conditioning, QC buffers, packaging prep, and sometimes USGA/R&A listing cadence. MOQ reflects real setup economics—batches, tooling, and coating runs—not just supplier preference.
✔ True — What “lead time” actually includes
Lead time isn’t just production days. It includes material sourcing, QC buffer, coating cure, packing prep, and sometimes compliance or listing readiness.
✘ False — “Once I pay, production starts right away”
Materials may need 5–10 days, molds must be set, and line slots arranged. Rushing risks lower quality or missed shipping windows.
Lead time is a chain, not a number. Materials need time. Molds need cleaning and, sometimes, repair. Core cure needs hours in press and cool-down. Cast urethane needs cure and post-cure. Clearcoats need time to reach hardness and odor targets. Printing needs scheduling for colorways.
Final inspection needs room for rework. Customs and shipping add more risk. Build a calendar that shows each block and its slack. You will ship more confidently.
✔ True — What MOQ really reflects in manufacturing
MOQ (Minimum Order Quantity) is not random. It’s based on raw material batches, machine setup cost, and packaging runs. Negotiating it requires trade-offs in price, timing, or customization.
✘ False — “MOQ is just supplier being lazy or rigid”
Thinking MOQ is just a made-up number can lead to friction. It’s tied to real production logic—understanding this helps you get flexibility the right way.
MOQ is not random either. It ties to batch sizes for core compounds, injection cycles, casting shells, and coating runs. You can trade off MOQ against price, timing, or customization. If you need flexibility, offer a rolling forecast, pay for tool changes, or group SKUs by shared color and coating. You will save cost without weakening quality.
Suggested CTA (B2B) Request a spec-based quote. Share your target compression, cover route, spin goal, a reference ball, and desired AQL/CPK thresholds. We will return a control-plan-backed proposal and a sample timeline you can share with your team.

FAQ
How many steps does it take to make a golf ball?
Answer: Typically 10–12, depending on mantle count and whether the cover is ionomer injection or cast urethane with post-cure. Shared steps include core mixing/vulcanization, core finishing, seam finishing, coating/printing, and final inspection/grading, followed by packaging and traceable lot coding.
What is the most critical step in the process?
Answer: Two steps set the ceiling: core mix/cure (distance and feel via compression/COR) and concentricity across layers (directional neutrality). After that, dimple fidelity and coating thickness uniformity keep the flight window consistent. Final QC (weight/diameter/symmetry/IV) protects conformity.
Are urethane balls always better than ionomer balls?
Answer: Not always—cast urethane favors tour feel and greenside spin, while ionomer favors durability, cost control, and tee-shot speed. The right choice depends on use case (range, game, tour), budget, and the consistency you require.
Does paint really affect distance?
Answer: Yes. Paint adds mass and surface roughness; μm-level uniformity preserves lift/drag balance. Uneven paint can add drag or create aero asymmetry, hurting carry and dispersion. Adhesion and abrasion resistance matter for long-term looks.
What standards define a conforming golf ball?
Answer: Weight ≤45.93 g, diameter ≥42.67 mm, limits on initial velocity and overall distance, and symmetry requirements per USGA/R&A programs. Your acceptance plan should reference these items and specify sampling depth, CPK goals, and stop-ship triggers.
Can I verify “tour-like” feel without a tour budget?
Answer: Yes. Lock compression, hardness gradients, and cover route. Sample spin at 50–100 yards with a controlled wedge test, then compare IV and dispersion with your reference ball. Audit concentricity and paint μm. You will get 80–90% of the confidence at a fraction of the cost.
Key Takeaway
Master five gates—core mix/cure, concentricity, cover & dimples, coating uniformity, and final QC. These control speed, straightness, stability, durability, and conformity. Everything else is optimization and branding.
You might also like — Top 3 Logo Printing Methods for OEM Golf Balls